
Gears of War: E-Day Steam charts measure concurrent players using Steam, not the game's total audience across Xbox consoles, the Xbox app on Windows, Game Pass, or cloud access. The available third-party trackers showed a substantial Steam launch audience after the October 6, 2026 release, but their exact live, 24-hour-peak, and all-time-peak figures did not agree on October 8, 2026 UTC (October 9 in Asia/Shanghai). Treat any live number as a moving estimate tied to one tracker and timestamp rather than a permanent total.
The launch readings show the scale of Steam activity: Steam activity reached the tens of thousands during the opening days, while ActivePlayer displayed a 20,374 average for both October 2026 and its “Last 30 Days” window on October 8 UTC. That average covered only the limited launch data collected so far. It was not a complete 30-day performance record, a count of unique buyers, or an all-platform population estimate.
What the Steam chart covers
The full Steam release is associated with Steam App ID 3010850. A separate beta exists under App ID 4059240, so beta statistics must not be merged into the retail game's chart. Gears 5 and Gears of War: Reloaded are also different products and cannot be used as substitutes when checking E-Day activity.
A Steam player count normally represents people running that Steam app at the same time. It does not tell you how many different people played during the day, how many copies were sold, how many Game Pass members launched the game, or how many players were active on Xbox. If the displayed count is 12,000 at one moment and 18,000 later, those readings are two concurrency snapshots; they cannot simply be added to produce 30,000 unique players.
The distinction matters especially for Gears of War: E-Day because the official platform information includes Xbox Series X|S, Windows 10/11, and Steam. Official Game Pass messaging also covers Ultimate and PC access. Someone playing through an Xbox console or the Xbox app on Windows is outside a Steam-only chart even when that person is playing the same game at the same time.
For the same reason, the following claims cannot be derived from a Steam chart:
- Total players across every supported platform
- Total unique players since release
- Copies sold on Steam or elsewhere
- Game Pass downloads, subscriptions, or retention
- Revenue, profit, or development-cost recovery
- The number of people playing campaign, Horde Siege, or Versus separately
- The size of the console population relative to the Steam population
Steam concurrency is still useful. It provides a consistent look at one identifiable segment of the audience, particularly for comparing activity by hour or day. It becomes misleading only when that segment is presented as the whole player base.
The first days of Steam activity
The standard global release occurred on October 6, 2026. Premium early access ran from October 1 through October 5, so the chart's earliest visible behavior can depend on whether a tracker recorded early-access sessions, the standard launch, or only the period after its own monitoring began.
On October 8, 2026 UTC, Tracker.gg explicitly said that it had tracked the Steam population since October 6 and had only two days of data. ActivePlayer also showed newly populated monthly and weekday sections. That short history is the main limitation of those early readings: labels such as “Last 30 Days,” “monthly average,” or “all-time peak” may look mature even when the underlying retail record covers only the first few days.
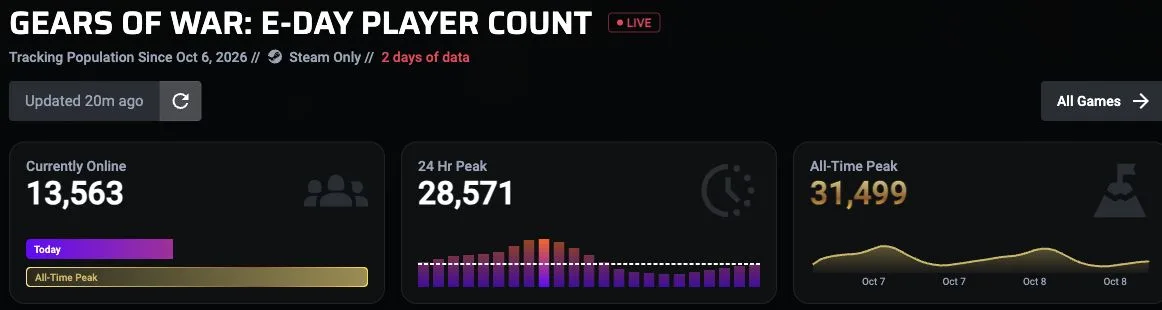
Tracker.gg displayed 13,563 current players, a 28,571 24-hour peak and a 31,499 all-time peak when viewed on October 9, 2026. These dated Steam-only readings change over time.
ActivePlayer listed 20,374 as the average Steam players for October 2026 and for its displayed Last 30 Days period. Read that as the average over the observations available to that dashboard at the time, not as a completed October average and not as 20,374 different people. A concurrent average measures simultaneous activity across recorded intervals; the same person may contribute to many intervals during one session.
Treat the screenshot’s October 9 Tracker.gg values separately from the earlier ActivePlayer average; they are different metrics and observations. The two dashboards refreshed at different times and reported slightly different 24-hour and all-time peaks, while even the live figure changed between sections of one page. Such differences are expected when caches and update schedules are not synchronized. A live count can move while a page is being refreshed, and a peak can be revised when another interval arrives.
Use a timestamp whenever you quote a live number. Without one, “current players” becomes outdated almost immediately. For a historical comparison, record the tracker, App ID, metric label, timezone, and refresh time together.
How to read the main Steam metrics
Steam chart pages group several measurements together, but each answers a different question.
| Metric | What it describes | What it does not establish |
|---|---|---|
| Currently online | Steam users running App ID 3010850 near the latest refresh | Today's unique players or the total audience on every platform |
| 24-hour peak | The highest observed Steam concurrency during the preceding rolling day | Copies sold, daily active users, or the launch peak unless it remains the record |
| All-time peak | The highest Steam concurrency recorded by that tracker for the retail app | The biggest Xbox population or the number of lifetime players |
| Average concurrent players | The mean Steam concurrency across the tracker’s available intervals | A count of distinct accounts or buyers |
| Monthly change | Difference between comparable monthly averages when enough periods exist | Growth when there is no complete previous month |
| Weekday activity | Average or peak behavior grouped by day, according to the page’s stated method | A dependable weekly pattern from only a few launch days |
The time range deserves as much attention as the number. An all-time peak from a two-day history means “highest recorded so far,” not a settled lifetime benchmark. A Last 30 Days panel launched during the same week contains only the days that have actually occurred or been collected. Empty weekday cells mean the tracker had no returned value for those cells; they should not be converted into zero-player days.
Timezone also changes how activity is grouped. ActivePlayer labeled its weekday averages as UTC. A Tuesday evening session in the United States can fall into Wednesday in UTC, so daily comparisons from different sites may not align unless their timezones and bucket boundaries match.
A useful reading order is:
- Confirm that the page is for App ID 3010850, not the beta or another Gears game.
- Find the page's refresh timestamp and stated timezone.
- Check whether the metric is live concurrency, an average, or a peak.
- Inspect the available tracking period before interpreting a monthly or all-time label.
- Compare only like-for-like metrics from equivalent time windows.
- Preserve the platform qualifier whenever sharing the result: these are Steam players only.
This method prevents a current count from being compared with a daily peak, or a partial launch week from being treated as a full month.
Why tracker totals can differ
Two pages can rely on Steam activity data and still display different numbers. Their refresh jobs may run at different minutes, their pages may cache sections for different lengths of time, and their peak calculations may close intervals on different schedules. A live counter can update every few minutes while a monthly table remains cached from an earlier run.
The dated E-Day dashboards showed that difference. ActivePlayer showed separate refresh times for its player trend, monthly history, Twitch panel, and search-interest panel. Tracker.gg stated that its live statistics updated every few minutes. Those sections should not be assumed to describe the same instant merely because they appear on one page.
When exact values disagree, do not choose the larger figure because it sounds more impressive or the smaller one because it appears more conservative. Instead, either quote one clearly identified, timestamped tracker or wait until the historical record stabilizes. Combining mismatched readings into a new exact number creates a figure that no source actually reported.
Rounding can be reasonable for conversational context, but it should remain visibly approximate. It is safer to say that Steam concurrency was in the tens of thousands during the initial release period than to preserve an exact live count long after its refresh time.
Why Steam is not the total player base
Gears of War: E-Day is available through more than one access route. The current official listings identify Xbox Series X|S and Windows 10/11, while the edition information explicitly includes Steam. Game Pass messaging covers Ultimate and PC. Steam charts observe only the Steam application, so they omit players entering through the Microsoft ecosystem.
A Steam purchase is also not the same thing as Xbox Play Anywhere access. Xbox Play Anywhere applies to Microsoft's purchasing route; it does not establish a Steam-to-console cross-buy entitlement. That purchasing distinction reinforces why Steam records cannot stand in for Microsoft Store, Xbox console, or Game Pass activity.
There is no supported conversion formula for turning the Steam count into a total population. Multiplying Steam concurrency by a guessed console ratio would manufacture an all-platform figure. Comments suggesting that most players are on Xbox or Game Pass may describe community expectations, but they do not supply a measured ratio.
Lobby impressions have the same limitation. A player may encounter many Xbox users during cross-platform play, but that experience is not a controlled population sample. It cannot establish that a particular percentage of all active players uses one platform.
The correct label is simple: Steam concurrent players. Keep that wording attached to live, peak, and average values.
Steam charts are not sales charts
Concurrent players and unit sales measure different things. A purchased copy contributes nothing to concurrency while its owner is offline, while one active player can appear in many consecutive measurement intervals. Game Pass access further separates play activity from conventional unit purchases.
The Steam charts therefore cannot verify worldwide sales, Steam unit sales, revenue, or profitability. They also cannot confirm claims that the game is sold out in a particular country. Physical availability, digital purchases, subscriptions, and simultaneous play are separate datasets.
A high launch peak can show that many Steam users played at once. It cannot reveal how many bought the game at full price, used another access method, refunded it, or returned later. Conversely, a falling concurrent count after a launch peak does not by itself prove poor sales. Single-player progress, workday schedules, time zones, new releases, and normal launch concentration can all affect when owners are simultaneously online, but the tracker figures do not quantify the contribution of any one cause.
For a defensible sales discussion, use actual sales evidence rather than converting player counts. No official worldwide units-sold total was established in the published reports.
Twitch and search interest are separate signals
Some player-count dashboards place Twitch viewing and Google search interest beside Steam concurrency. These panels add context, but neither measures people playing the game.
Twitch viewers are people watching streams, and live channels are broadcasts. One viewer might own the game, be considering a purchase, or simply watch a creator. A Twitch audience can be larger or smaller than the Steam population without contradicting the Steam chart because the units are different.
Google Trends uses a relative index from 0 to 100. A value of 100 marks the peak interest within that series; it does not mean 100 searches or 100 players. Regional rankings likewise describe relative search interest, not regional ownership or concurrency.
Keep the signals in separate sentences when discussing launch attention:
- Steam concurrency describes simultaneous activity for the Steam app.
- Twitch viewership describes a streaming audience.
- Google Trends describes relative search interest.
- Sales data describes purchases or estimated purchases.
Adding these numbers together would be meaningless because they count different things.
A reliable way to check the chart now
Because live values expire quickly, use the following verification routine whenever you need an updated E-Day player count:
- Open a Steam population tracker and confirm that it identifies Gears of War: E-Day with App ID 3010850.
- Reject pages for beta App ID 4059240, Gears 5, or Gears of War: Reloaded.
- Record the page's displayed refresh time before copying any value.
- Label the value precisely as current Steam concurrency, 24-hour Steam peak, all-time Steam peak, or average Steam concurrency.
- Note how long the tracker has collected retail data. Do not treat a partial month as a completed month.
- If another tracker differs, compare timestamps and metric definitions instead of assuming one is wrong.
- Preserve “Steam only” in any headline, chart caption, or social post.
- Do not translate the result into total players, sales, or Xbox activity without a separate dataset that directly measures those quantities.
For historical tracking, take readings at consistent times and keep the same source and timezone. That produces a cleaner comparison than mixing a morning live count from one service with an evening peak from another.
The useful conclusion from the launch data
The early charts establish that Gears of War: E-Day drew a meaningful Steam concurrency audience during its first retail days. They do not establish the complete size of the Gears audience, and the short observation window makes long-term retention conclusions premature.
The exact live figure will continue to change, while peak and average records may settle as trackers collect more intervals. Use App ID 3010850, quote the refresh time, identify the metric, and keep the Steam-only limitation visible. That is enough to make the chart useful without turning it into an unsupported claim about sales or the entire Xbox and PC player base.